|
Country Forest Data [sorted by region]
[Source: Food and Agriculture Organization of the U.N.: The State of the World's Forests 2003]
Additional deforestation tables and statistics are available at the deforestation stats page. There is also an news version of this page with stats from 2000-2005.
This web site has thousands of pages on deforestation. You may also be interested in An Overview of Deforestation, deforestation pictures, and current deforestation news blog. There is also a section that explains deforestation to children.
Country Forest Data [sorted by region]
|
| Total Land Area | Total Forest | Forest % of land area | Forest Change | Annual rate of change |
|
| 2000 | 2000 | 2000 | 1990-2000 | 1990-2000 |
|
| Country | (�000 ha) | (�000 ha) | % of land | (�000 ha) | (%) |
|
| | | | | |
|
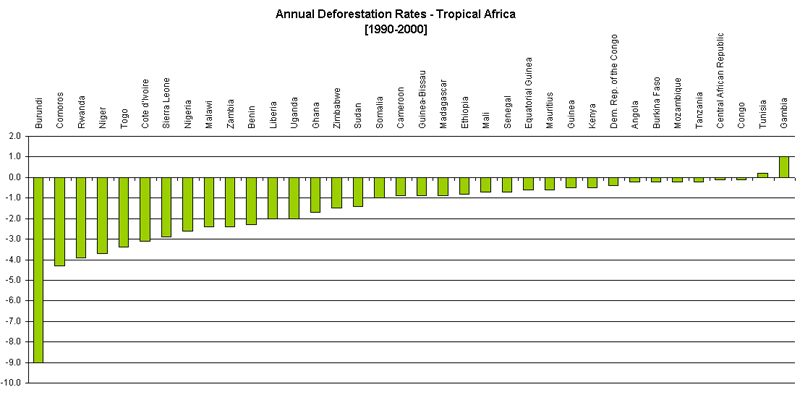
| Africa | 2,978,394 | 649,866 | 21.8 | -5,262 | -0.8 |
|
| | | | | |
|
| Angola | 124,670 | 69,756 | 56.0 | -124 | -0.2 |
|
| Benin | 11,063 | 2,650 | 24.0 | -70 | -2.3 |
|
| Burkina Faso | 27,360 | 7,089 | 25.9 | -15 | -0.2 |
|
| Burundi | 2,568 | 94 | 3.7 | -15 | -9.0 |
|
| Cameroon | 46,540 | 23,858 | 51.3 | -222 | -0.9 |
|
| Central African Republic | 62,297 | 22,907 | 36.8 | -30 | -0.1 |
|
| Comoros | 186 | 8 | 4.3 | n.s. | -4.3 |
|
| Congo | 34,150 | 22,060 | 64.6 | -17 | -0.1 |
|
| Cote d�Ivoire | 31,800 | 7,117 | 22.4 | -265 | -3.1 |
|
| Dem. Rep. of the Congo | 226,705 | 135,207 | 59.6 | -532 | -0.4 |
|
| Equatorial Guinea | 2,805 | 1,752 | 62.5 | -11 | -0.6 |
|
| Ethiopia | 110,430 | 4,593 | 4.2 | -40 | -0.8 |
|
| Gabon | 25,767 | 21,826 | 84.7 | -10 | n.s. |
|
| Gambia | 1,000 | 481 | 48.1 | 4 | 1.0 |
|
| Ghana | 22,754 | 6,335 | 27.8 | -120 | -1.7 |
|
| Guinea | 24,572 | 6,929 | 28.2 | -35 | -0.5 |
|
| Guinea-Bissau | 3,612 | 2,187 | 60.5 | -22 | -0.9 |
|
| Kenya | 56,915 | 17,096 | 30.0 | -93 | -0.5 |
|
| Liberia | 11,137 | 3,481 | 31.3 | -76 | -2.0 |
|
| Madagascar | 58,154 | 11,727 | 20.2 | -117 | -0.9 |
|
| Malawi | 9,409 | 2,562 | 27.2 | -71 | -2.4 |
|
| Mali | 122,019 | 13,186 | 10.8 | -99 | -0.7 |
|
| Mauritius | 202 | 16 | 7.9 | n.s. | -0.6 |
|
| Mozambique | 78,409 | 30,601 | 39.0 | -64 | -0.2 |
|
| Niger | 126,670 | 1,328 | 1.0 | -62 | -3.7 |
|
| Nigeria | 91,077 | 13,517 | 14.8 | -398 | -2.6 |
|
| Rwanda | 2,466 | 307 | 12.4 | -15 | -3.9 |
|
| Sao Tome and Principe | 95 | 27 | 28.3 | n.s. | n.s. |
|
| Senegal | 19,252 | 6,205 | 32.2 | -45 | -0.7 |
|
| Seychelles | 45 | 30 | 66.7 | n.s. | n.s. |
|
| Sierra Leone | 7,162 | 1,055 | 14.7 | -36 | -2.9 |
|
| Somalia | 62,734 | 7,515 | 12.0 | -77 | -1.0 |
|
| Sudan | 237,600 | 61,627 | 25.9 | -959 | -1.4 |
|
| Tanzania | 88,359 | 38,811 | 43.9 | -91 | -0.2 |
|
| Togo | 5,439 | 510 | 9.4 | -21 | -3.4 |
|
| Tunisia | 16,362 | 510 | 3.1 | 1 | 0.2 |
|
| Uganda | 19,964 | 4,190 | 21.0 | -91 | -2.0 |
|
| Zambia | 74,339 | 31,246 | 42.0 | -851 | -2.4 |
|
| Zimbabwe | 38,685 | 19,040 | 49.2 | -320 | -1.5 |
[Click to enlarge]
|
| Total Land Area | Total Forest | Forest % of land area | Forest Change | Annual rate of change |
|
| 2000 | 2000 | 2000 | 1990-2000 | 1990-2000 |
|
| Country | (�000 ha) | (�000 ha) | % of land | (�000 ha) | (%) |
|
| | | | | |
|
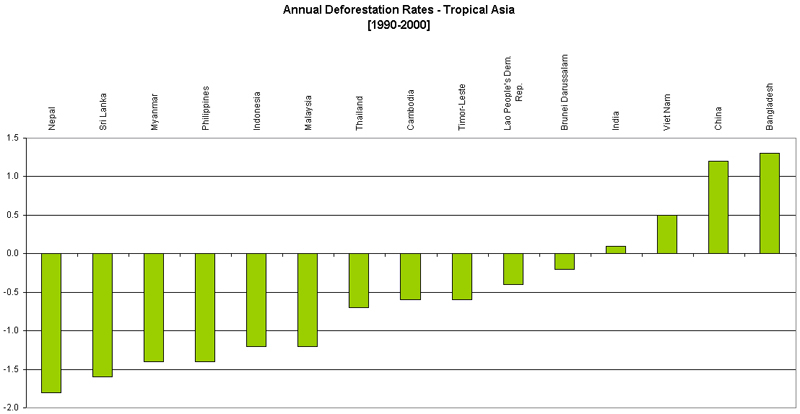
| Asia | 3,084,746 | 547,793 | 17.8 | -364 | -0.1 |
|
| | | | | |
|
| Bangladesh | 13,017 | 1,334 | 10.2 | 17 | 1.3 |
|
| Bhutan | 4,701 | 3,016 | 64.2 | n.s. | n.s. |
|
| Brunei Darussalam | 527 | 442 | 83.9 | -1 | -0.2 |
|
| Cambodia | 17,652 | 9,335 | 52.9 | -56 | -0.6 |
|
| China | 932,743 | 163,480 | 17.5 | 1,806 | 1.2 |
|
| India | 297,319 | 64,113 | 21.6 | 38 | 0.1 |
|
| Indonesia | 181,157 | 104,986 | 58.0 | -1,312 | -1.2 |
|
| Lao People's Dem. Rep. | 23,080 | 12561 | 54.4 | -53 | -0.4 |
|
| Malaysia | 32,855 | 19,292 | 58.7 | -237 | -1.2 |
|
| Maldives | 30 | 1 | 3.3 | n.s. | 54.4 |
|
| Myanmar | 65,755 | 34,419 | 52.3 | -517 | -1.4 |
|
| Nepal | 14,300 | 3,900 | 27.3 | -78 | -1.8 |
|
| Philippines | 29,817 | 5,789 | 19.4 | -89 | -1.4 |
|
| Singapore | 61 | 2 | 3.3 | n.s. | n.s. |
|
| Sri Lanka | 6,463 | 1,940 | 30.0 | -35 | -1.6 |
|
| Thailand | 51,089 | 14,762 | 28.9 | -112 | -0.7 |
|
| Timor-Leste | 1,479 | 507 | 34.3 | -3 | -0.6 |
|
| Viet Nam | 32,550 | 9,819 | 30.2 | 52 | 0.5 |
[Click to enlarge]
|
| Total Land Area | Total Forest | Forest % of land area | Forest Change | Annual rate of change |
|
| 2000 | 2000 | 2000 | 1990-2000 | 1990-2000 |
|
| Country | (�000 ha) | (�000 ha) | % of land | (�000 ha) | (%) |
|
| | | | | |
|
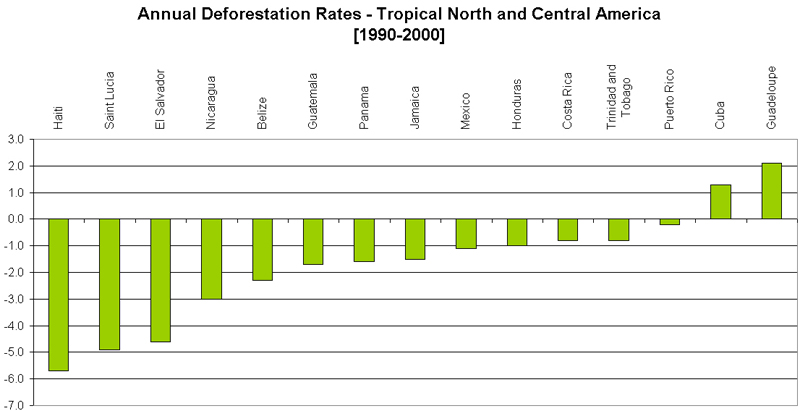
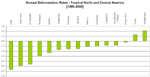
| North and Central America | 2,136,966 | 549,304 | 25.7 | -570 | -0.1 |
|
| | | | | |
|
| Antigua and Barbuda | 44 | 9 | 20.5 | n.s. | n.s. |
|
| Bahamas | 1,001 | 842 | 84.1 | n.s. | n.s. |
|
| Barbados | 43 | 2 | 4.7 | n.s. | n.s. |
|
| Belize | 2,280 | 1348 | 59.1 | -36 | -2.3 |
|
| Bermuda | 5 | - | - | - | - |
|
| British Virgin Islands | 15 | 3 | 20.0 | n.s. | n.s. |
|
| Cayman Islands | 26 | 13 | - | n.s. | n.s. |
|
| Costa Rica | 5,106 | 1,968 | 38.5 | -16 | -0.8 |
|
| Cuba | 10,982 | 2,348 | 21.4 | 28 | 1.3 |
|
| Dominica | 75 | 46 | 61.3 | n.s. | -0.7 |
|
| Dominican Republic | 4,838 | 1,376 | 28.4 | n.s. | n.s. |
|
| El Salvador | 2,072 | 121 | 5.8 | -7 | -4.6 |
|
| Greenland | 34,170 | - | - | - | - |
|
| Grenada | 34 | 5 | 14.7 | n.s. | 0.9 |
|
| Guadeloupe | 169 | 82 | 48.5 | 2 | 2.1 |
|
| Guatemala | 10,843 | 2,850 | 26.3 | -54 | -1.7 |
|
| Haiti | 2,756 | 88 | 3.2 | -7 | -5.7 |
|
| Honduras | 11,189 | 5,383 | 48.1 | -59 | -1.0 |
|
| Jamaica | 1,083 | 325 | 30.0 | -5 | -1.5 |
|
| Martinique | 107 | 47 | 43.9 | n.s. | n.s. |
|
| Mexico | 190,869 | 55,205 | 28.9 | -631 | -1.1 |
|
| Montserrat | 11 | 3 | 27.3 | n.s. | n.s. |
|
| Netherlands Antilles | 80 | 1 | n.s. | n.s. | n.s. |
|
| Nicaragua | 12,140 | 3,278 | 27.0 | -117 | -3.0 |
|
| Panama | 7,443 | 2,876 | 38.6 | -52 | -1.6 |
|
| Puerto Rico | 887 | 229 | 25.8 | -1 | -0.2 |
|
| Saint Kitts and Nevis | 36 | 4 | 11.1 | n.s. | -0.6 |
|
| Saint Lucia | 61 | 9 | 14.8 | -1 | -4.9 |
|
| Saint Pierre and Miquelon | 23 | - | - | - | - |
|
| Saint Vincent and Grenadines | 39 | 6 | 15.4 | n.s. | -1.4 |
|
| Trinidad and Tobago | 513 | 259 | 50.5 | -2 | -0.8 |
|
| United States | 915,895 | 225,993 | 24.7 | 388 | 0.2 |
|
| United States Virgin Islands | 34 | 14 | 41.2 | n.s. | n.s. |
[Click to enlarge]
|
| Total Land Area | Total Forest | Forest % of land area | Forest Change | Annual rate of change |
|
| 2000 | 2000 | 2000 | 1990-2000 | 1990-2000 |
|
| Country | (�000 ha) | (�000 ha) | % of land | (�000 ha) | (%) |
|
| | | | | |
|
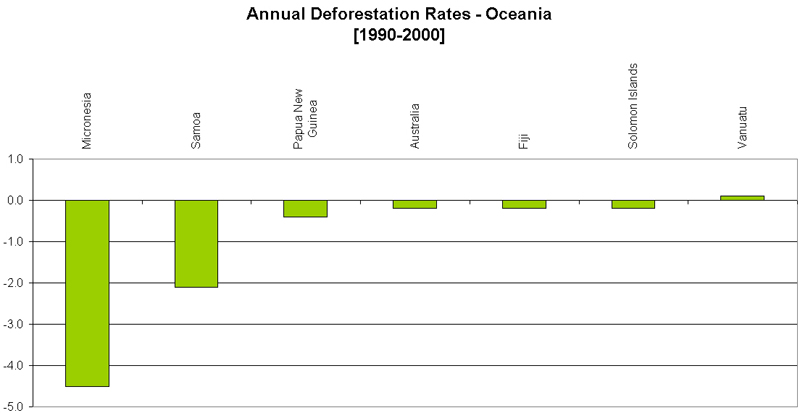
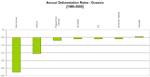
| Oceania | 849,096 | 197,623 | 23.3 | -365 | -0.2 |
|
| | | | | |
|
| American Samoa | 20 | 12 | 60.1 | n.s. | n.s. |
|
| Australia | 768,230 | 154,539 | 20.1 | -282 | -0.2 |
|
| Cook Islands | 23 | 22 | 95.7 | n.s. | n.s. |
|
| Fiji | 1,827 | 815 | 44.6 | -2 | -0.2 |
|
| French Polynesia | 366 | 105 | 28.7 | n.s. | n.s. |
|
| Guam | 55 | 21 | 38.2 | n.s. | n.s. |
|
| Kiribati | 73 | 28 | 38.4 | n.s. | n.s. |
|
| Marshall Islands | 18 | n.s. | - | n.s. | n.s. |
|
| Micronesia | 69 | 15 | 21.7 | -1 | -4.5 |
|
| Nauru | 2 | n.s. | - | n.s. | n.s. |
|
| New Caledonia | 1,828 | 372 | 20.4 | n.s. | n.s. |
|
| Niue | 26 | 6 | - | n.s. | n.s. |
|
| Northern Mariana Islands | 46 | 14 | 30.4 | n.s. | n.s. |
|
| Palau | 46 | 35 | 76.1 | n.s. | n.s. |
|
| Papua New Guinea | 45,239 | 30,601 | 67.6 | -113 | -0.4 |
|
| Samoa | 282 | 105 | 37.2 | -3 | -2.1 |
|
| Solomon Islands | 2,856 | 2,536 | 88.8 | -4 | -0.2 |
|
| Tonga | 73 | 4 | 5.5 | n.s. | n.s. |
|
| Vanuatu | 1,218 | 447 | 36.7 | 1 | 0.1 |
[Click to enlarge]
|
| Total Land Area | Total Forest | Forest % of land area | Forest Change | Annual rate of change |
|
| 2000 | 2000 | 2000 | 1990-2000 | 1990-2000 |
|
| Country | (�000 ha) | (�000 ha) | % of land | (�000 ha) | (%) |
|
| | | | | |
|
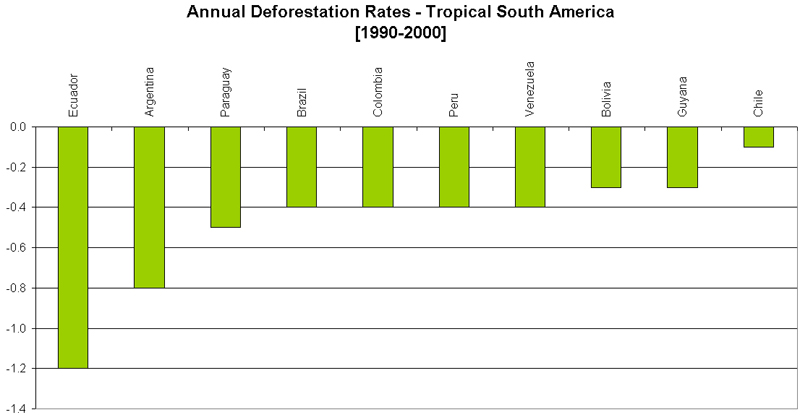
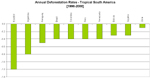
| South America | 1,754,741 | 885,618 | 50.5 | -3,711 | -0.4 |
|
| | | | | |
|
| Argentina | 273,669 | 34,648 | 12.7 | -285 | -0.8 |
|
| Bolivia | 108,438 | 53,068 | 48.9 | -161 | -0.3 |
|
| Brazil | 845,651 | 543,905 | 64.3 | -2,309 | -0.4 |
|
| Chile | 74,881 | 15,536 | 20.7 | -20 | -0.1 |
|
| Colombia | 103,871 | 49,601 | 47.8 | -190 | -0.4 |
|
| Ecuador | 27,684 | 10,557 | 38.1 | -137 | -1.2 |
|
| French Guiana | 8,815 | 7,926 | 89.9 | n.s. | n.s. |
|
| Guyana | 21,498 | 16,879 | 78.5 | -49 | -0.3 |
|
| Paraguay | 39,730 | 23,372 | 58.8 | -123 | -0.5 |
|
| Peru | 128,000 | 65,215 | 50.9 | -269 | -0.4 |
|
| Suriname | 15,600 | 14,113 | 90.5 | n.s. | n.s. |
|
| Venezuela | 88,206 | 49,506 | 56.1 | -218 | -0.4 |
[Click to enlarge]
|
|